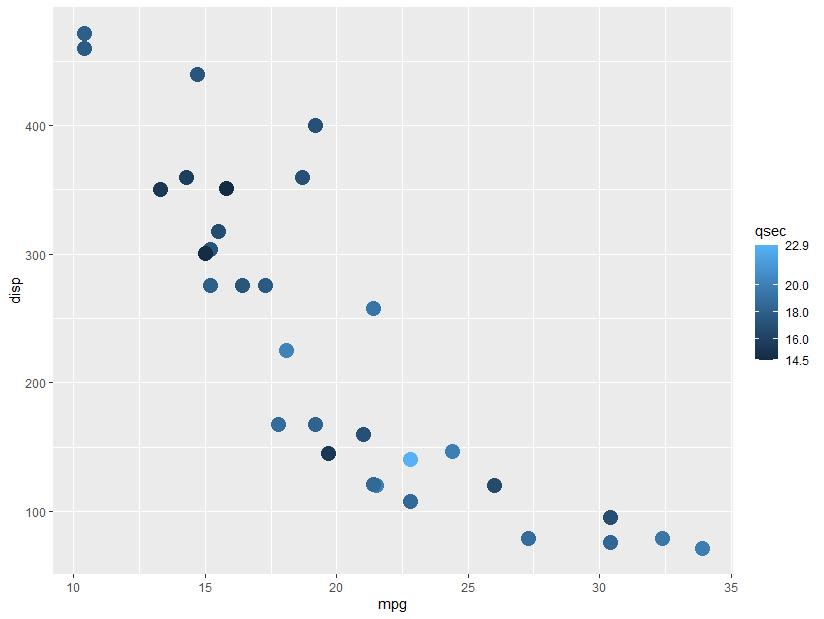
Labeling minimum and maximum values on a fill color guide in #rstats #ggplot2

This took me a while to understand, and even though I think this should be built in somewhere, I ended up with the following function:

# Function to show min and max values on fill color bars.
# Inspiration from https://stackoverflow.com/a/60732101/2152245
# original_func should be something like "scales::breaks_pretty(3)"
breaks_min_max <- function(original_func) {
    function(x) {
        original_result <- original_func(x)
        breaks <- c(min(x),
                  original_result,
                  max(x))
breaks_sort <- sort(breaks)
# If values are too close, drop one of them
close <- diff(breaks_sort) < 1
breaks_sort <- breaks_sort[!close]
breaks_sort
    }
}

Note the very rough method of determining when labels will be too close together. This would need to be modified if working with negative numbers or values that are all decimals.

In use:

ggplot(mtcars,
aes(x = mpg,
y = disp,
color = qsec)) +
geom_point(size = 5) +
scale_color_continuous(breaks = breaks_min_max(scales::breaks_pretty(4)))

Result:


Update 2021-09-28:

If you have a log scale, this will also work if you use breaks_log(). Example below. This seems to be sensitive to the number of breaks you set; for the example below, 4 doesn’t work (the top and bottom values aren’t labeled), but 6 does.

ggplot(mtcars, aes(x = mpg, y = disp, color = qsec)) +
geom_point(size = 5) +
scale_color_continuous(trans = "log10",
breaks = breaks_min_max(scales::breaks_log(6)))

Exploring genealogy with R: readgedcom and tidygraph

My code is an absolute mess right now, but here’s a fun plot showing everyone in my family GEDCOM. With so many people, it’s hard to visualize all of them at once, and most software provides one or the other of a descendant tree or an ancestor tree.

Colors on this plot show whether a person is a terminal ancestor (no parents) or terminal descendant (no children). You can also tell that I don’t have the graph (connections between people) set up properly, because I don’t have that many unrelated individuals in this GEDCOM (at least, I shouldn’t). Overall I think this is a good start and eventually I can end up with a poster.

network plot with lots of circles and arrows
Red = terminal ancestor, green = terminal descendant, blue = neither.

Hack Grand Forks – 311

I’ve been thinking about this for a while, and finally took a few evenings to do it. I built a Mastodon bot that toots each Grand Forks 311 request: https://botsin.space/@hackgfk_311. It also crossposts at https://twitter.com/hackgfk_311.

The code can be found at https://github.com/mattbk/hack-grand-forks. Yes, I built it in R.

Mastodon toots from @hackgfk_311@botsin.space.

Why “hack”? In the sense that this is information that should be more available to people, and I’m making it more available without going to a separate location. Perhaps something good can come of it.

sum() with raster::aggregate() in R

If you try to use sum() directly in raster::aggregate() and have NA values, you’ll get NA as a result. You need to build a tiny function and pass the rm.na=T command to sum(). More succintly:

# Dissolve duplicate geometries and sum OOIP
 fm <- raster::aggregate(fm.raw,
                         by="OilFieldID",
                         sums=list(list(function(x) sum(x,na.rm=T),
                                        "OOIP_pooltable")))


Comparing two lists with R

No, not list() lists.

a <- data.frame(name=old$NAME)
a$status <- "old"
b <- data.frame(name=allfields[allfields$StateAbbre=="ND",]$name)
b$status <- "new"

both<-merge(a,b,by="name",all=T)

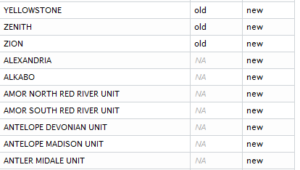
Make two data frames, one for each list, create a column identifying each one (new or old), then join on the common column (name).

Output:

Example output from comparing to lists in R using a merge().

See also: http://stackoverflow.com/questions/17598134/compare-two-lists-in-r/17599048#17599048